Spatiotemporal Analysis of Imbalanced Parking Demand and Supply
CP 8883 - Fall 2024, Final Project Report
Jaegeon Lee, Seungjae Lieu, and Thanawit Suwannikom
Introduction

In rapidly growing urban areas, the availability and equitable distribution of parking spaces are essential for sustaining urban mobility and ensuring the efficient functionality of cities. An imbalance between parking demand and supply has significant implications, contributing to issues such as traffic congestion, inefficient land use, and environmental challenges. Moreover, the increasing pace of urbanization, coupled with fluctuating vehicle usage patterns throughout the day, poses additional challenges for cities attempting to address this imbalance effectively.
The imbalance between parking demand and supply in urban areas has been extensively studied, revealing significant impacts on traffic congestion, land use efficiency, and environmental quality. Ibrahim (2017) identifies the rapid increase in car ownership and ineffective land use planning as primary contributors to parking shortages, leading to traffic congestion and inefficient land utilization. Shoup (2005) discusses how underpriced or free parking exacerbates urban congestion, as drivers spend additional time searching for available spaces, thereby increasing traffic volumes and associated emissions. Furthermore, the proliferation of parking infrastructure consumes substantial urban land, which could otherwise support housing or green spaces, thus affecting urban density and environmental quality. The environmental consequences of excessive parking infrastructure are also notable. The abundance of parking spaces encourages car use, leading to increased emissions of pollutants such as nitrogen oxides and carbon monoxide, which degrade air quality and contribute to environmental degradation.
Addressing the imbalance between parking demand and supply is crucial for enhancing urban mobility, optimizing land use, and mitigating environmental impacts. Strategies such as dynamic performance-based pricing for parking spaces have been proposed to reduce vehicle circling and improve space utilization, thereby decreasing traffic congestion and emissions. Moreover, the adoption of smart parking systems can lead to more efficient use of existing parking structures and land, as well as reductions in congestion caused by drivers searching for parking.
References
- Ibrahim, H. (2017). The Rapid Increase in Car Ownership and Ineffective Land Use Planning as Contributors to Parking Shortages.
- Shoup, D. (2005). The High Cost of Free Parking. Chicago: Planners Press, American Planning Association.
- Huntsman, B., Lasley, P., Galarza, M. (2017). Finding the Value of Urban Parking: An Analysis of the Impacts of Smart Parking Systems on Congestion and Land Values in Downtown Houston.
- Daniel, M., Yun, B., Yanfeng, O. (2015). Dynamic Performance-Based Pricing for Parking to Reduce Vehicle Circling and Improve Utilization.
Research Goals
Our research goal is to evaluate the imbalance between parking lot supply and demand at different times of day and days of the week by analyzing the following scenarios:
- Parking supply remains constant, but demand varies based on time of day and day of the week.
- Parking supply is measured by the total number of the parking spaces available in a parking lot.
- Parking demand is estimated based on visits to nearby points of interest using the inverse-2SFCA method.

Data
Parking Lots Data
SafeGraph Parking Lots
In this study, we primarily utilized parking lot data from SafeGraph, as it offers more comprehensive data points for surface parking lots. The table below outlines the schema of the parking lot data provided by SafeGraph.
The City of Atlanta area contains a total of 5,221 parking lots, as depicted in the map below.

OSM Parking Lots
The parking lot data from OpenStreetMap were utilized because it includes information on the number of parking spaces. We specifically filtered the data to include only parking lots classified as 'surface' type.
Demand / Visitor Counts
We utilized the Monthly Pattern - Foot Traffic data from Advan Research to estimate the demand for parking lots. This dataset provides aggregated and anonymized insights into the number of visits to specific points of interest (e.g., businesses, retail locations, parks, schools) derived from mobile device location data.
The following information of the dataset were used in this analysis.
- raw_vsit_counts: The monthly aggregated counts of visits to the POI, captured from mobile devices
- visit_home_aggregation: The number of visits to the POI from each census Block Group (BG) based on the visitor's home location
In the City of Atlanta, there are 29,103 POIs from Advan Research data. The following map shows the POIs with monthly visits.

Methodology
Parking Spaces Regression
The parking lot data from SafeGraph offers a greater number of data points but lacks information on the number of parking spaces. In contrast, the data from OSM includes parking space details. To leverage the strengths of both datasets, we combine them and apply linear regression to estimate the number of parking spaces based on the geometric area of the parking lots.

The scatter plot below illustrates the relationship between the number of parking spaces and the geometry areas of parking lots. A noticeable linear trend can be observed, suggesting a potential correlation between the two variables.

Parking Demand Estimation
From the visitor data for POIs, we excluded the number of visitors traveling from nearby census block groups (within a 0.5-mile buffer) under the assumption that these visitors likely walked to the POIs and did not require parking. Additionally, we excluded visitors who potentially used public transit to reach the POIs. This adjustment was made by estimating transit accessibility for each POI using a gravity-based model and reducing the number of visitors presumed to have driven. The figures below illustrate the logic behind our calculation of visits to POIs.


We then used the Two-step Floating Catchment Area (2SFCA) method to estimate the parking demands loaded to each parking lot. 2SFCA is a widely used accessibility measure to see how many resources (i.e., facilities) an individual can access to within certain geographical distributions of resources supplied and individuals in demand (Luo and Wang, 2003). In detail, the 2SFCA method consists of the following two steps:
- Measure how much resources, provided by each supplying facility, are available with respect to an individual in demand, considering the competition she or he (they) face with others for the resources at that facility.
- Sum up the available resources from multiple supply facilities within a certain boundary of each individual.
Since our study focuses on the degree of scarcity or over-supply of parking lots in Atlanta, we decided to use the inverted version of 2SFCA, which was suggested and theoretically verified by Wang (2018). In the inverted version of 2SFCA, the unit of analysis changes from individuals to facilities, parking lots in our study. Along with illustrations, our method of estimating parking demands consists of two steps:
- Distribute parking demand of each POI to nearby parking lots: Presume that there are 20 visitors to POI C. The parking demands of these 20 visitors are split into the two nearby parking lots. Here, we consider the distance decay effect where the possibility of an individual visitor choosing a certain parking lot is inverse to the distance between the POI she or he intends to visit and the parking lot (please refer to the equation below). Walking distances between POIs and parking lots were calculated using the Open Street Routing Machine (OSRM), and the decay effect has been considered for only the parking lots within the 10-minute walking distance from each POI. Three distance decay parameters (k=1, 2, 3) were used, according to the literature (Luo and Wang, 2003), but we mainly discuss the outputs based on the parameter k=2 in our Result section.
- Summing up the loaded demands by parking lot: The next step is to sum up the parking demands loaded to each parking lot from the visitor groups of multiple nearby POIs. These aggregated parking demands will be compared with the capacity of each parking lot.


References
- Luo, W., and Fahui, W. Measures of Spatial Accessibility to Health Care in a GIS Environment: Synthesis and a Case Study in the Chicago Region. Environment and Planning B: Planning and Design, 30(6), 865–884. https://doi.org/10.1068/b29120.
- Wang, F. “Inverted Two-Step Floating Catchment Area Method for Measuring Facility Crowdedness.” The Professional Geographer, 70(2), 251–260. https://doi.org/10.1080/00330124.2017.1365308.
Results
Parking Supply
In the figure below shows the linear regression results using parking lot geometry area as independent variable to predict parking spaces. The r-square value is 0.69 which is not high but indicates a some level of linear relationship between geometry area and parking spaces.

Parking Demand
Demand Over Time
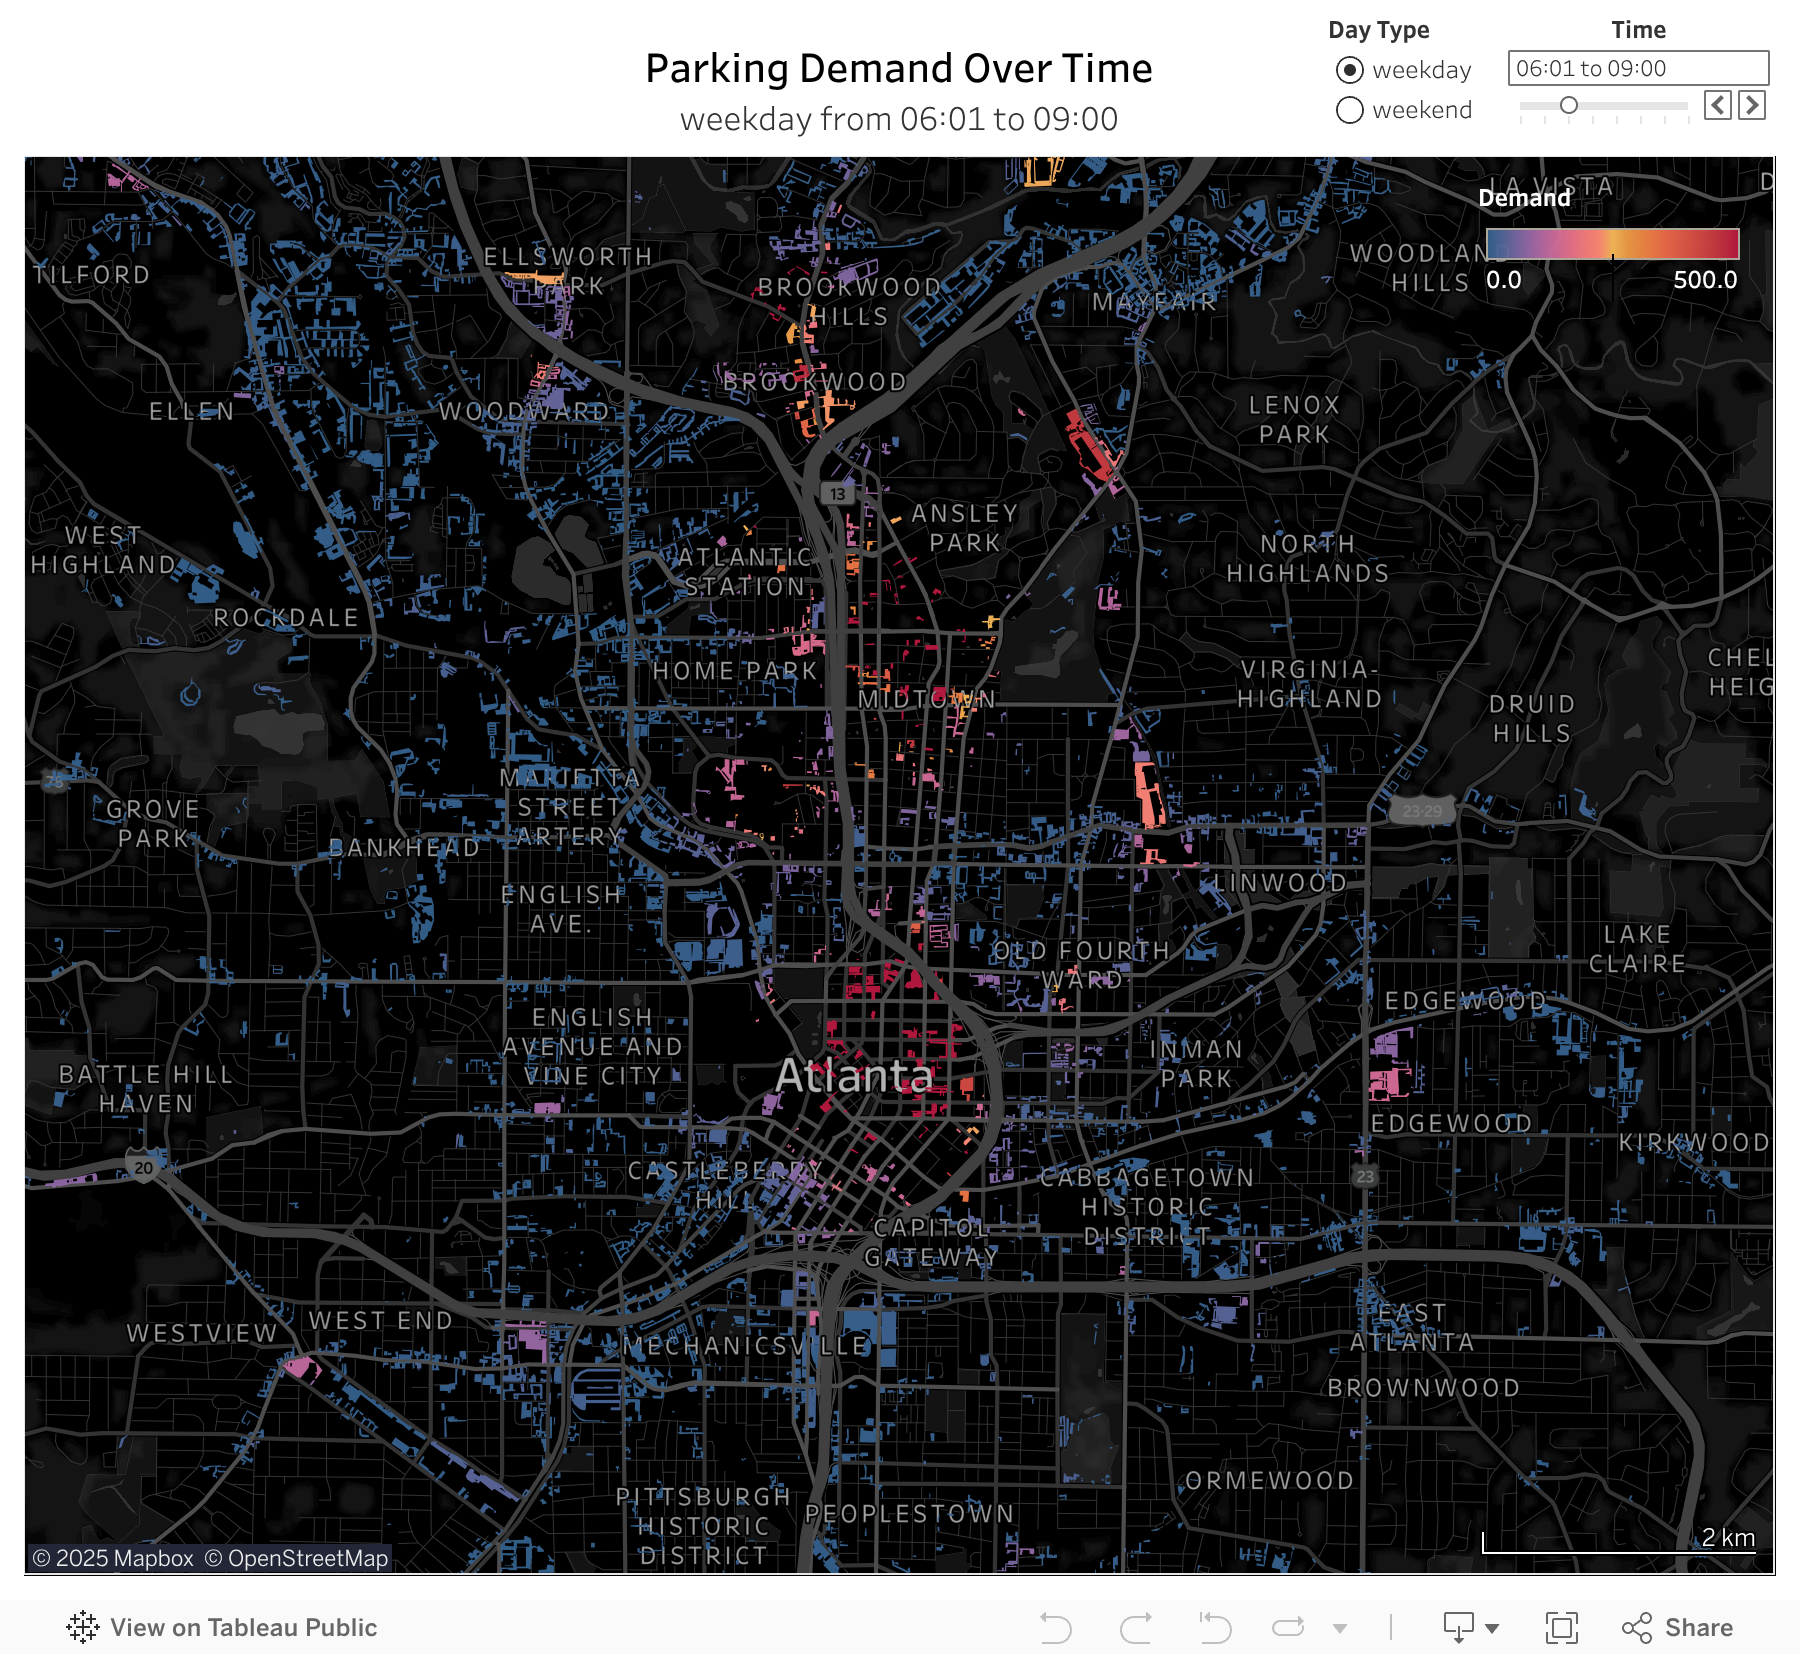
The following animation shows the parking demand in Atlanta's city area as a choropleth map. The animation on the left displays the average demand over time on weekdays, while the right shows the average demand over time on weekends.
The choropleth map highlights areas with high parking demand. From the two charts, we observe that Midtown and Downtown consistently experience high demand, while certain areas show elevated demand only during specific times of the day.


The following is interactive visualization where user can pick time of day and day type (weekday or weekend) to see parking demand of particular location.
Demand By Location
Using the estimated parking demand by time of day, we can identify periods with high demand issues in specific areas. Three locations were selected for analysis: Downtown, Glenwood Park, and Beltline & Ponce City Market.

The results show that Downtown consistently faces over-demand issues throughout the day, whereas Glenwood Park and BeltLine & Ponce City Market experiences over-demand in specific periods of time.
Imbalanced Parking Demand and Supply
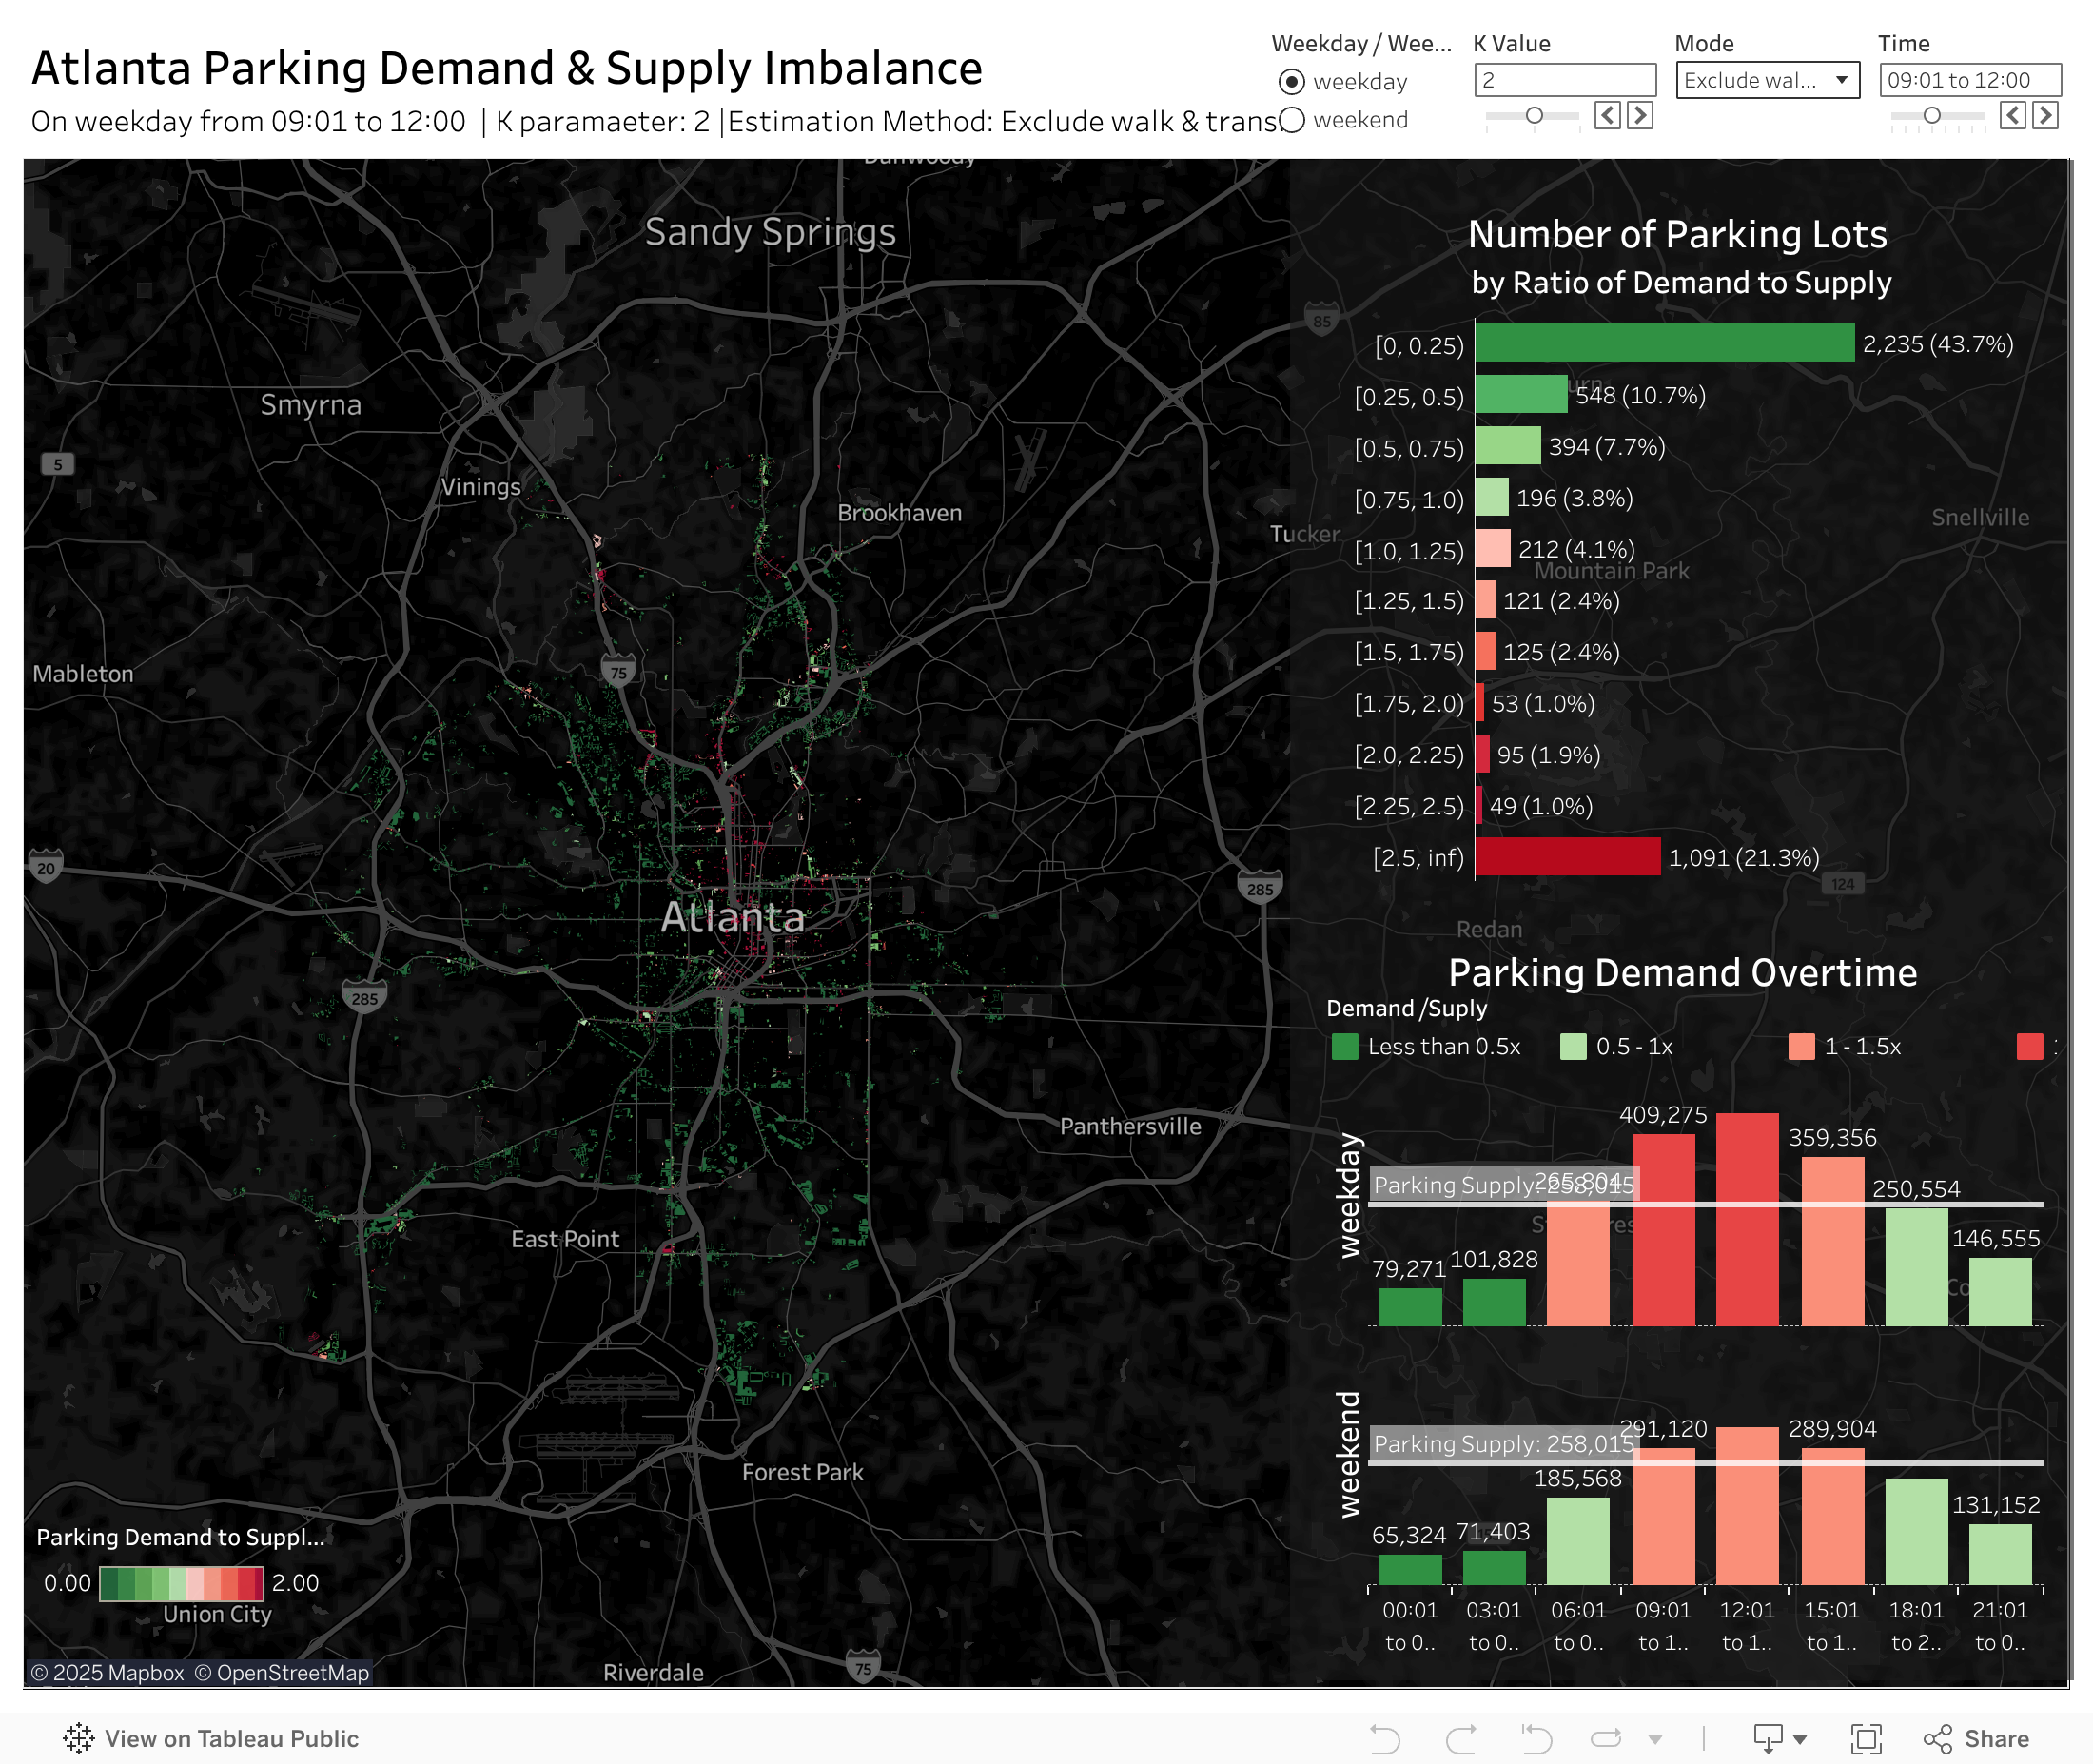
We developed an interactive dashboard to visualize the imbalance in the parking demand-to-supply ratio using a choropleth map. The dashboard includes filters for parameters such as the exponential decay parameter (k), day type (weekday or weekend), demand estimation mode, and time of day.
The map displays the locations and spatial geometries of parking lots in the City of Atlanta. Polygons are color-coded to represent the degree of imbalance between parking demand and supply: darker reds indicate areas with high over-demand, while darker greens highlight areas of oversupply. On the right-hand side, the top bar chart shows the distribution of parking imbalance in the area, and the bottom bar chart illustrates the demand versus referenced supply of the parking lots over time.
Users can select specific polygons on the map using Tableau's selection tools to filter parking lots within their areas of interest. The bar charts dynamically update to reflect data corresponding to the selected polygons, offering a focused view of the parking dynamics in the chosen regions.
For better visualization, please view this dashboard on laptop or desktop monitor.
Conclusion
Based on our analysis, we would like to discuss the following three points particularly regarding parking management policies in cities.
First, we notice that even places with fairly high transit access face parking overdemand issues. Two metro lines, line Red and Gold, go through the Midtown Atlanta area, placing the area as one of the places with higher levels of transit accessibility in the city. However, as we can see from the figure below, the Midtown also suffers from parking over-demand issues. This might be because the transit accessibility here is not high enough to promote people to opt for public transit over personal vehicles or there are other problems besides accessibility to stations in the public transit system (e.g., long headways and dispatch intervals).

Second, focusing on local scales, we notice that parking demands do not often spread across nearby parking lots. The two figures below show zoomed-in distributions of estimated parking demands near the Ponce City Market area, a famous attraction in Atlanta. While there are parking lots available for Whole Foods Market and Home Depot above the Ponce de Leon Avenue (refer to the map on the left-side), those spaces are estimated to be not fully used by the visitors of the Ponce City Market whose parking lot is estimated to be full (refer to the map on the right-side). While further investigations on the actual parking usage are needed, we would like to note that chances that people are reluctant to cross roads after parking exist. What if the roads that visitors need to cross after parking to get to their final destinations (i.e., POIs) have crosswalks without traffic lights? What if the average speed of vehicles on roads is so high that people feel unsafe to cross the road? These hazards may affect visitors' parking behaviors and, as a result, lead to inefficient use of parking spaces across urban areas. For planning practices, we suggest that walkability between parking lots and POIs should be improved to address parking imbalance problems and eventually downsize parking lots or at least avoid enlarging them due to inefficient uses.


Third, we created an interactive map dashboard, which can be used for parking management policies. There is much debate going on regarding the reform of parking requirement policies in cities across the US (Marsden, 2006; Willson, 2018). Such policies require both assessments on status quo and simulations based on projections of future parking demands. Additionally, the supply and demand dynamics of parking varies across contexts, specifically the density of development, the overall transportation infrastructure in the city, and the categories of POIs, etc. This implies that the assessment of parking imbalance should be monitored and estimated for each case and from the perspective of diverse stakeholders. We suggest that our interactive map, which allows users to adjust different time periods and parameters, can be instrumental to facilitating the debate on the parking management policies and to assisting local businesses and building facility operators.
Below is the interactive map or you can click here to see in full page.
References
- Marsden, G. (2006). The Evidence Base for Parking Policies - A Review. Transport Policy, 13(6), 447-457.
- Willson, R. (2018). Parking Reform Made Easy. Parking and the City (pp. 213-221). Routledge.
Limitations & Improvements
Limitations
- The regression model used to estimate parking capacities achieved an R-squared value of 0.69, indicating a moderate fit and leaving room for improvement in prediction accuracy.
- The study relies on assumptions about walking or public transit usage to estimate the proportion of visitors requiring parking, which may not reflect actual behavior.
- A simplified assumption of one visitor per vehicle was made, potentially oversimplifying the complexity of visitor behavior and vehicle occupancy patterns.
Improvements
To address the above limitations, we propose the following improvements for future studies:
- Incorporating additional features, such as the number of nearby points of interest (POIs) and the built environment characteristics of the area, and applying advanced machine learning models, could enhance the predictive accuracy of parking capacity estimates.
- Validating the proportion of visitors who travel by car would improve the reliability of the demand estimates. This can be achieved by collecting data on car-traveling visitors from a representative sample of locations and fine-tuning the model based on the collected data.